Home
Zero@Ecosystem
Ekoten Fabrics Pilot
Scene 01 // Opening

Ekoten already has the data.

Ekoten already generates valuable operational data every day: energy, water, production, laboratory, quality, certification and shipment data. The question is not whether the data exists. The question is whether it can become usable for sustainability decisions.

Pilot Validation 10+ Data Sources
Scene 02 // Fragmented Data

But the data lives in many places.

Factory data often does not live in one system. It may sit across ERP exports, Excel sheets, laboratory reports, meter readings, certificate folders and historical reporting files. This makes sustainability tracking manual, slow and dependent on individual effort.

Fragmented Systems Scattered Formats
SAP ERP Database
Energy_Meter_Q3.xlsx
GOTS_Certificate.pdf
Steam_Pressure_M1.log
OEKO-TEX_Standard100
Dye_Colorfastness_Report
Water_Discharge_2025.csv
MES Batch Tracking
Scene 03 // Zero@Production Intake

Zero structures factory data into one intelligence layer.

Zero@Production is designed to bring fragmented factory data into one operational intelligence layer. Data can enter through SAP / ERP systems, email, Excel sheets, laboratory reports and future API connections. The goal is not to force the factory to change overnight, but to translate existing data into a shared industrial data language.

Standardized Schema Adapter Automation
https://production.zeroatecosystem.com/intake-hub.html
Zero@Production Multi-Channel Data Intake Hub
Scene 04 // Validation

Missing and inconsistent data becomes visible.

The system highlights missing, inconsistent or weakly evidenced data points. Missing meter logs, expired certificates, inconsistent production volumes or unclear water usage can become visible action items before the reporting deadline.

Automated Audits Data Completeness
https://production.zeroatecosystem.com/normalization-studio.html
Zero Normalization Studio Interface
GOTS Scope Expired
Missing Gas Reading
Volume Inconsistency
Scene 05 // Sustainability KPIs

Operational data becomes sustainability intelligence.

Structured data can support decision metrics such as energy intensity, water use, waste, carbon data preparation and production efficiency. The purpose is not to produce a final certified footprint inside the demo. The purpose is to provide a stronger data foundation for sustainability teams and future verification workflows.

Dynamic KPI Calculations PEF/LCA Data Ready
https://production.zeroatecosystem.com/control-tower.html
Zero Control Tower Dashboard Interface
Energy Index
4.82 kWh/kg
Water Intensity
58.4 L/kg
Carbon Data Prep
1.94 kg CO2e
Production Yield
97.6%
Scene 06 // Pilot Metrics

Pilot success means matching real results with 75–80% coverage.

The pilot success criterion can be practical and measurable. Can we ingest Ekoten’s historical operational data and generate outputs that are comparable with known factory results? If the system can structure around 75–80% of required data fields, identify the remaining gaps clearly and generate usable readiness reports, the pilot can be considered successful.

75%-80% Target Simulated Verification
Data Stream Coverage Verification
Reconstructed
Target
Water Meter Reconciliation 82% / 100%
Electricity Meter Logging 78% / 100%
Steam & Gas Consumption 76% / 100%
Material & Yield Tracking 85% / 100%
PILOT SUCCESS TARGET METRIC 80.2% AVG DATA COVERAGE
Scene 07 // Decision Layer

One factory. One data language. One decision layer.

This creates a common data layer for factory management, sustainability teams, operations and external stakeholders when needed. The aim is not to multiply reports, but to create one traceable and decision-ready view of factory performance.

Unified Interface Executive Export
https://production.zeroatecosystem.com/executive-reports.html
Zero Executive Dashboard Reports Interface
Ekoten x Zero@Ecosystem

What we do for Ekoten Fabrics:
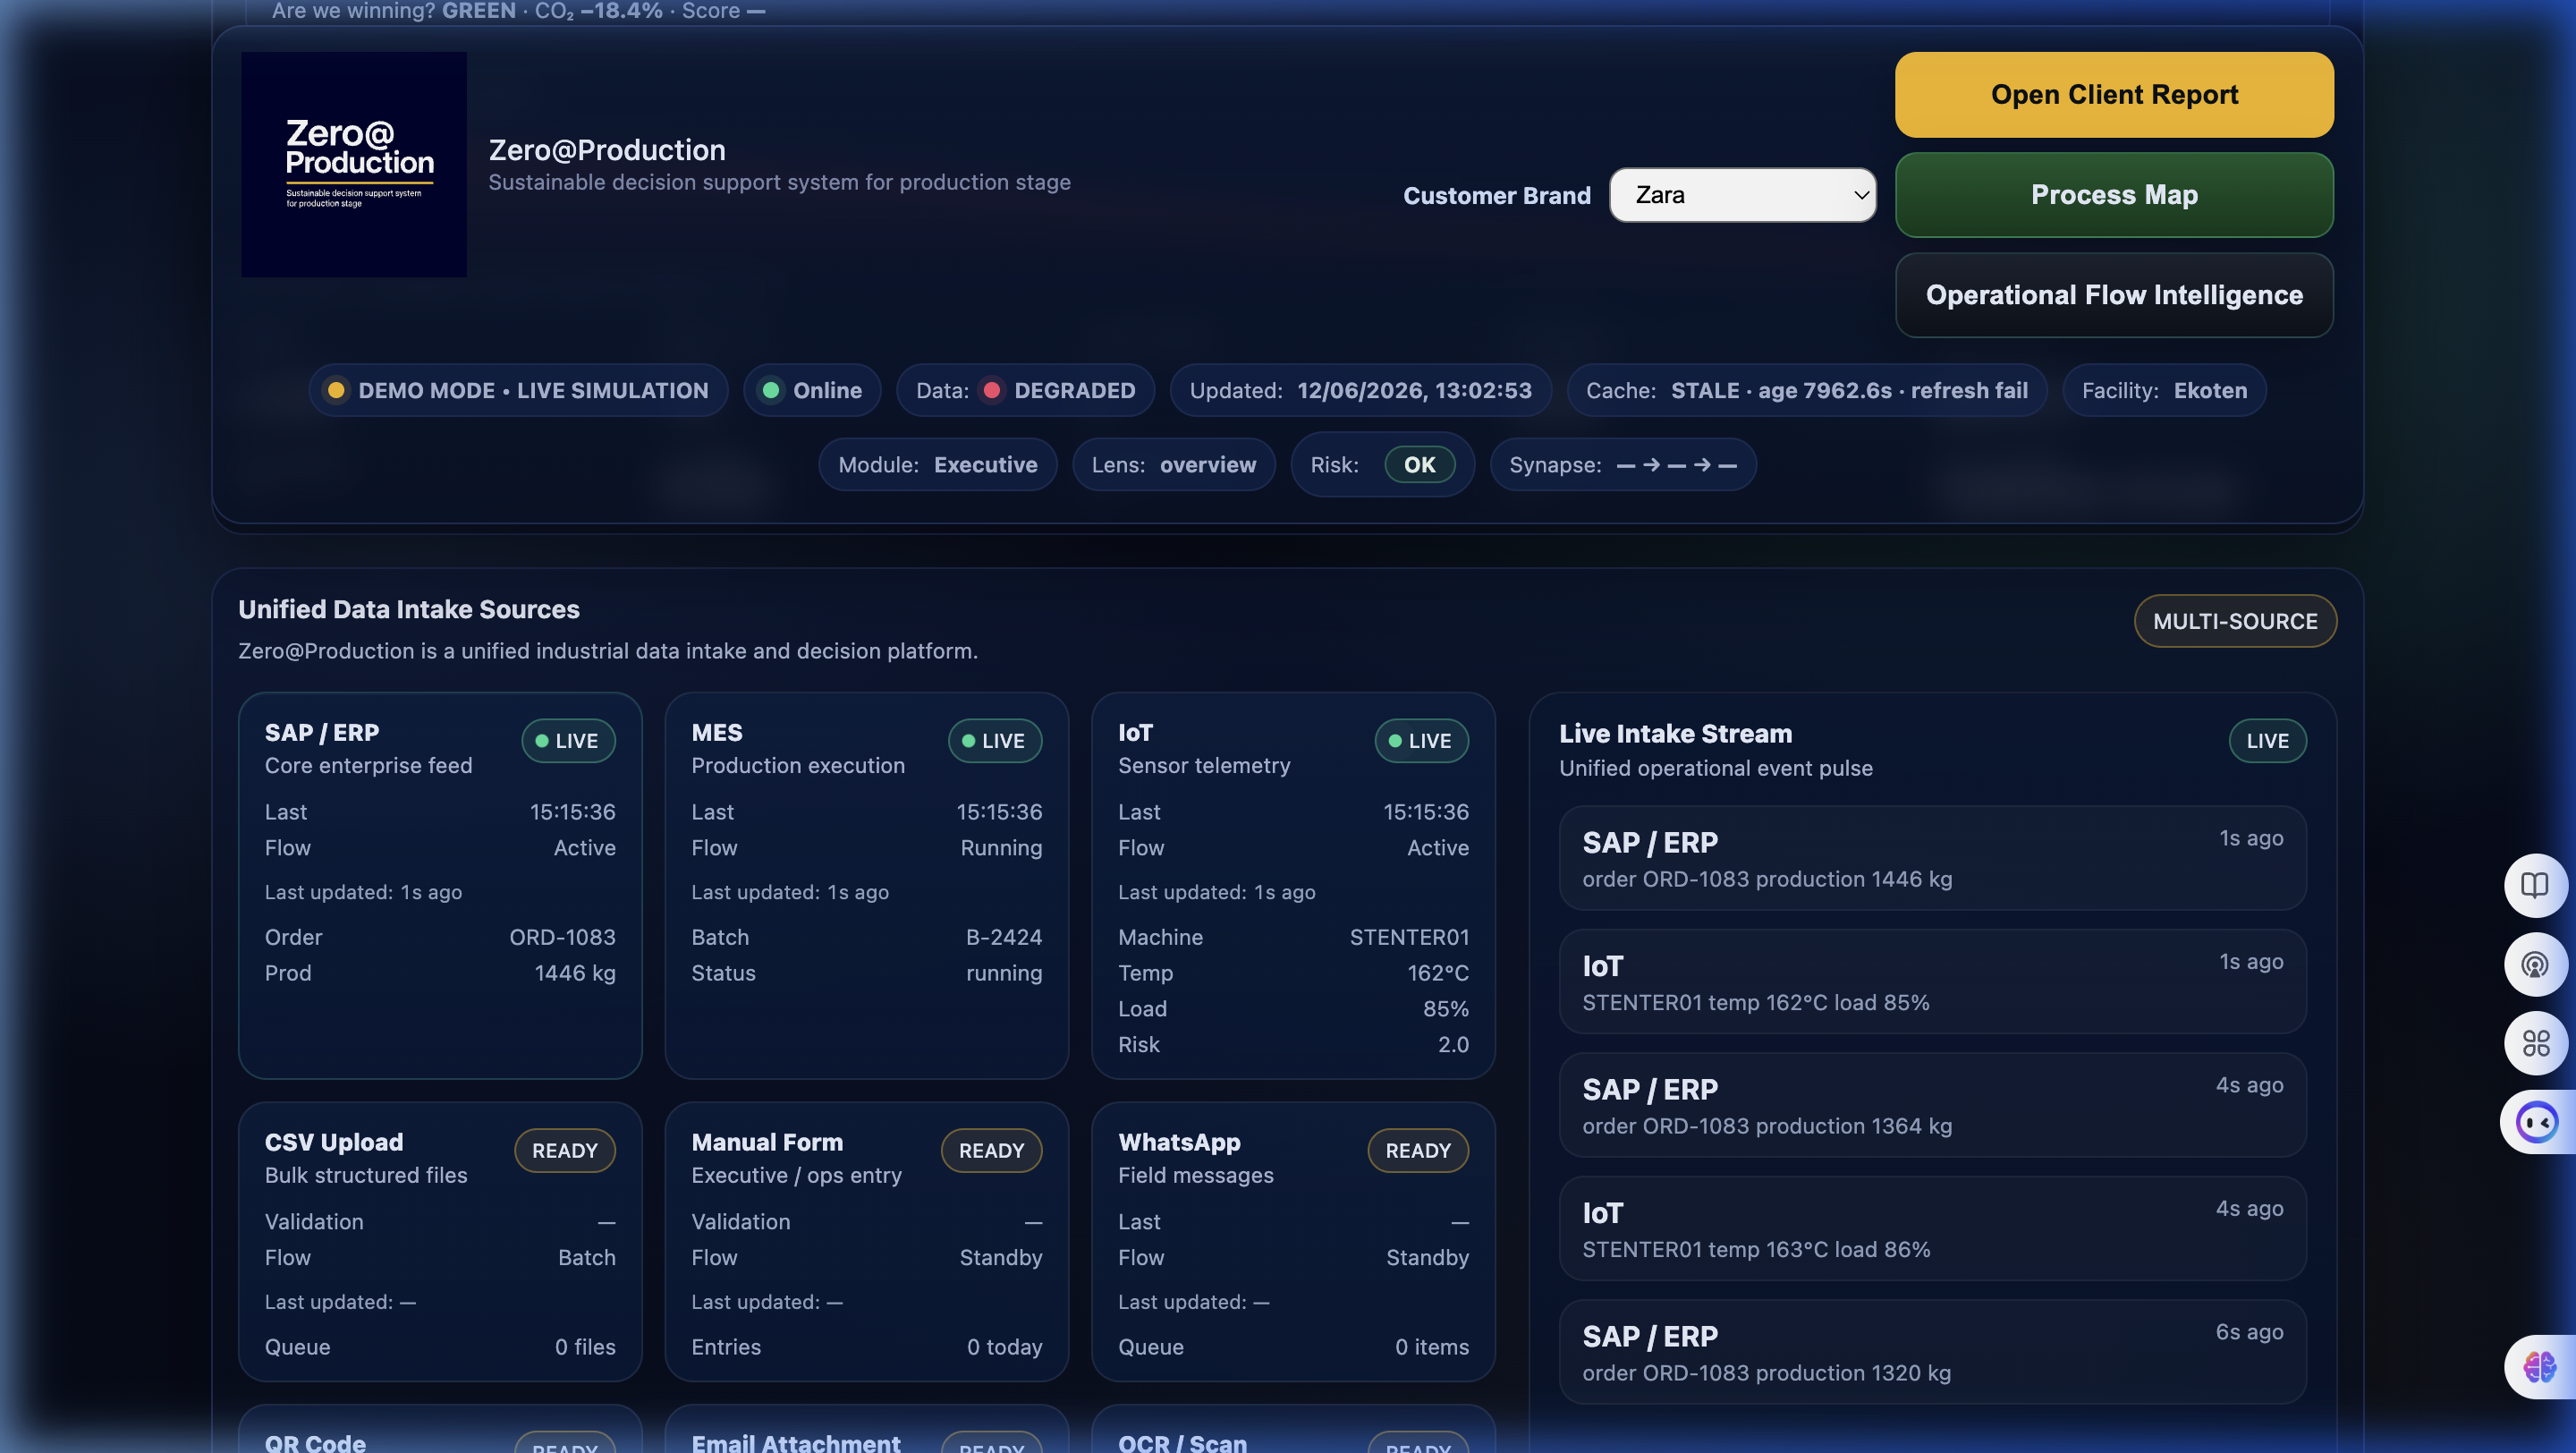
From factory data to decision intelligence.

The proposed Ekoten pilot is simple: use real factory data, structure it, make gaps visible, compare outputs with historical results and measure whether the system creates practical value. If successful, Zero becomes more than a dashboard; it becomes a sustainability decision-support layer for industrial operations.

Zero@Production is not a replacement for Ekoten’s existing systems, auditors or sustainability experts. It is a data execution layer that makes existing factory data more structured, visible and useful for sustainability decisions.

Pilot Success Criteria

75–80% Structured Coverage

Injest and structure electricity, steam, gas, water, and output datasets.

Visibility of Gaps

Highlight missing readings, expired certs, or inconsistent values automatically.

Evidence-Linked Layer

Connect data points directly to verification files, invoices, or certificate pdfs.

Comparison-Ready Outputs

Generate reconstructed datasets that can be benchmarked against historical outputs.

Usable Readiness Reports

Generate readiness data sheets for Ekoten management and sustainability teams.

Practical Workflow Fit

Ensure zero disruption and smooth compatibility with Ekoten's existing software.

Continue to Live Demo
01 // Opening
02 // Silos
03 // Intake
04 // Validation
05 // KPIs
06 // Pilot Target
07 // Decision
08 // Summary
Playing Slide 1 of 8 Duration: ~8s per scene Ekoten Fabrics x Zero@Ecosystem Pilot Plan
Disclaimer: This demo does not replace Ekoten’s existing ERP, auditors, LCA experts or sustainability teams. It structures existing factory data into a decision-support layer for sustainability intelligence and pilot validation.